1.1 Beats and Sound Waves
What exactly is sound? It's a harder question than one might think, one that is often overlooked in general high school classes, and one that we need to cover in some detail before learning some more advanced music and acoustical theory. In this lesson, we'll develop some intuition for how sound actually works, look at some numbers we use to describe sound waves, and study some interesting emergent properties of sound that will be important later.
1.1.1. A Brief Introduction to Sound Waves
Most introductions to sound waves begin with a diagram of a sine wave with crests and troughs labeled; however, as good as that is to know, such a simplistic diagram can conceal what's actually going on when something produces a sound. Sound, for our purposes, is a periodic variation of pressure in some medium, like air or water. When a percussionist strikes a drum, the drum head vibrates back and forth and, as it does so, causes the repeated compression and rarefaction (the opposite of compression) of air particles around it. These compressions and rarefactions travel as a pressure wave through the air until they reach your ear.
If you downloaded Audacity, go ahead and record something, then zoom in on the resulting waveform. You should see something like this if you zoom in far enough:
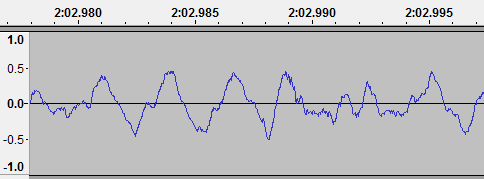
Figure 1.1.1
Now what is going on here? Well, Audacity is relaying to you graphically the data it picked up from your microphone. A point above zero on this waveform means that the measured air pressure was higher than atmospheric pressure, a point below zero means the air pressure was lower.
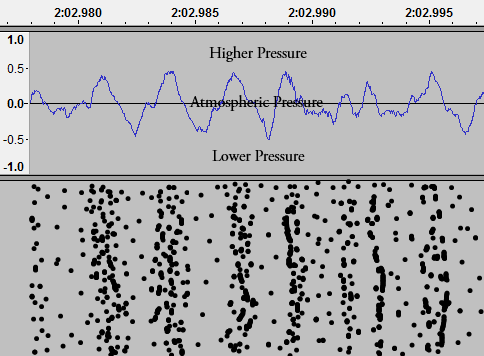
Figure 1.1.2
In this graphic, the individual black dots represent air particles, and those dots line up with the data shown in Audacity. Your microphone and your ear can both be thought of as super-specialized barometers which are built to detect very small and periodic variations in pressure. All the 2D sound waves seen on paper or a computer screen are just shorthands for what is actually going on in a medium with a sound wave passing through it.
The kind of wave described here is called a longitudinal wave, and it's how sound travels through most materials. However, in solids, sound can also travel as a transverse wave, which we will not explore here.
1.1.2. How a Microphone Works
Because I will be referencing it a lot, it is important to get a good idea of what is actually going on when you record something with a microphone. Go ahead and zoom in as far as you can on your waveform in Audacity. You should see a bunch of little lines on the wave, like this:
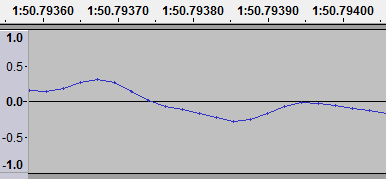
Figure 1.1.3
You might already know that movies are made up of a bunch of still images, flashed very rapidly on the screen to give the illusion of fluid movement. Microphones work much the same way - since it is impossible to measure pressure at every point in time, microphones sample pressure at discrete points in time at a very specific rate. My microphone samples at 44100 Hz; in other words, 44100 times per second my microphone measures pressure and sends that data to Audacity.
When you press play, your computer sends the mountains of data collected by the microphone to your speakers, where the exact same compressions and decompressions are performed in order to recreate the sound. Of course, the recreation cannot be perfect because the microphone can only measure a finite number of samples, but under most conditions it's hard to tell the difference.
1.1.3. Measuring Sound
The properties of sound waves that we are interested in this tutorial are wavelength, frequency, speed, amplitude, and intensity. We will go through each of these measurements and get a feel for what they tell us about our sound wave. But first, I think we are ready for that classic labeled sine wave image:
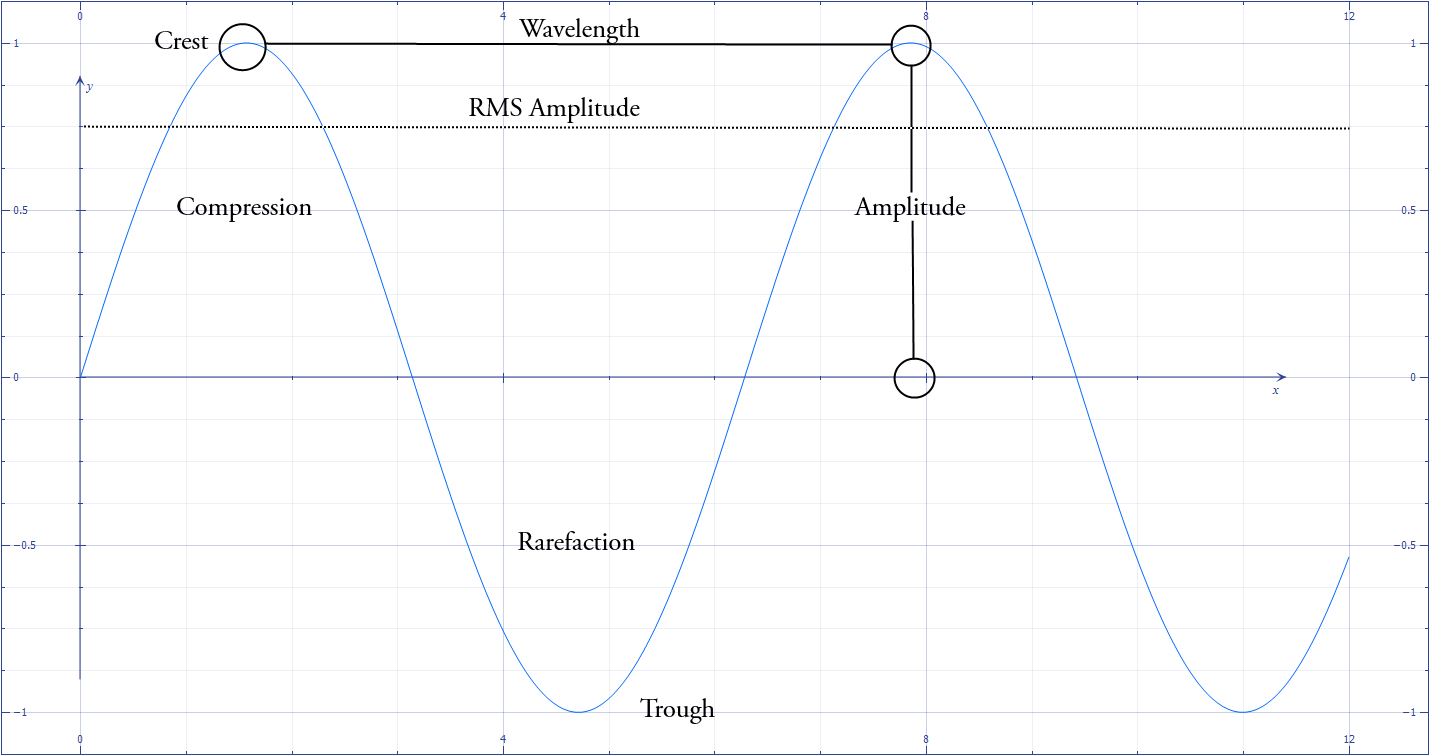
Figure 1.1.4
Some of this vocabulary might be unfamiliar. Crests and troughs are respectively the local peaks and valleys of the waveform. If we are thinking about the wave as a pressure wave, then crests are the points where the particles of the medium are the most compressed, and the troughs are the points where those particles are the least compressed. The rest of the terms will be explained in the next few paragraphs.
Wavelength, Frequency, and the Speed of Sound
Wavelength (λ) is simply the distance in meters between two crests or two troughs, and is labeled on Figure 1.1.4. Frequency (f) is related to wavelength by the following equation:
\(C = λf\)
where c is the speed of sound in the particular medium the sound wave is traveling through. Frequency measures how often a point on the waveform repeats per unit time, usually in seconds. If frequency units are expressed in 1/seconds, then that unit is abbreviated as Hertz or Hz.
For example, if a microphone detects 500 compressions (or crests) over a period of five seconds, then that signal has a frequency of 100 Hz. The speed of sound at sea level is 340.29 m/s, so that means that the signal has a wavelength of 3.4029 meters.
We perceive frequency as pitch. That 100 Hz signal corresponds with a sharp G.
Amplitude and Intensity
On Figure 1.1.4 you see amplitude labeling the height of one of the peaks of the waveform; this is more accurately called a peak deviation of the wave (peak deviations are the local extremes on the waveform - be they maxima or minima). Amplitude attempts to measure the oscillations between the extreme peak deviations of the wave.
So how do we get a number for amplitude? We can't try to find the average amplitude, because it will equal zero for an ideal wave (like a sine wave) or near zero for a recording, because the waveform spends equal amounts of time in positive and negative values. So, instead, we use a technique called the root mean squared (RMS) method.
Suppose we want to know the RMS amplitude of that Audacity recording. To do so, all we need to do is square every sample the microphone took (making every value positive), take the arithmetic average of the squared samples, and then take the square root of the average. In figure 1.1.4, the RMS amplitude is about 0.707, or 1/root 2. I am not dedicated enough to figure out the RMS amplitude of my Audacity recording.
Intensity is a measure of how loud a sound is, and it is measured in decibels. Decibels are an enormous headache and aren't terribly relevant to our discussion, so we will not go into them here. Feel free to research them on your own.
If this amplitude and intensity section didn't make much sense, don't worry - we won't use it in the rest of our discussion. I have included it simply because it is an important topic that I couldn't leave out.
1.1.4. Beats
Now that we have a feel for the physics of sound waves, we can start applying that knowledge to music. In the next section we'll start talking about combinations of sounds that sound pleasant, but first, we'll discuss what makes sounds sound out of tune. If you've ever played in an ensemble with other musicians, then you're probably familiar with the characteristic beating sound that occurs when two instruments are out of tune. Those waa-waa sounds present in poorly-tuned chords and unisons are unpleasant to most people, but how do they come about?
Beats are a characteristic of the wave nature of sound. When two waves interact, they combine into a new, composite waveform - waves add. If a point on one wave is negative while that same point on another is positive, then those points combine to create a point with less amplitude than before; this is called destructive interference. Constructive interference occurs when the opposite happens.
For example, take two sine waves, one with a frequency 1.2 times the other. These are shown below in Figures 1.1.5a and 1.1.5b.
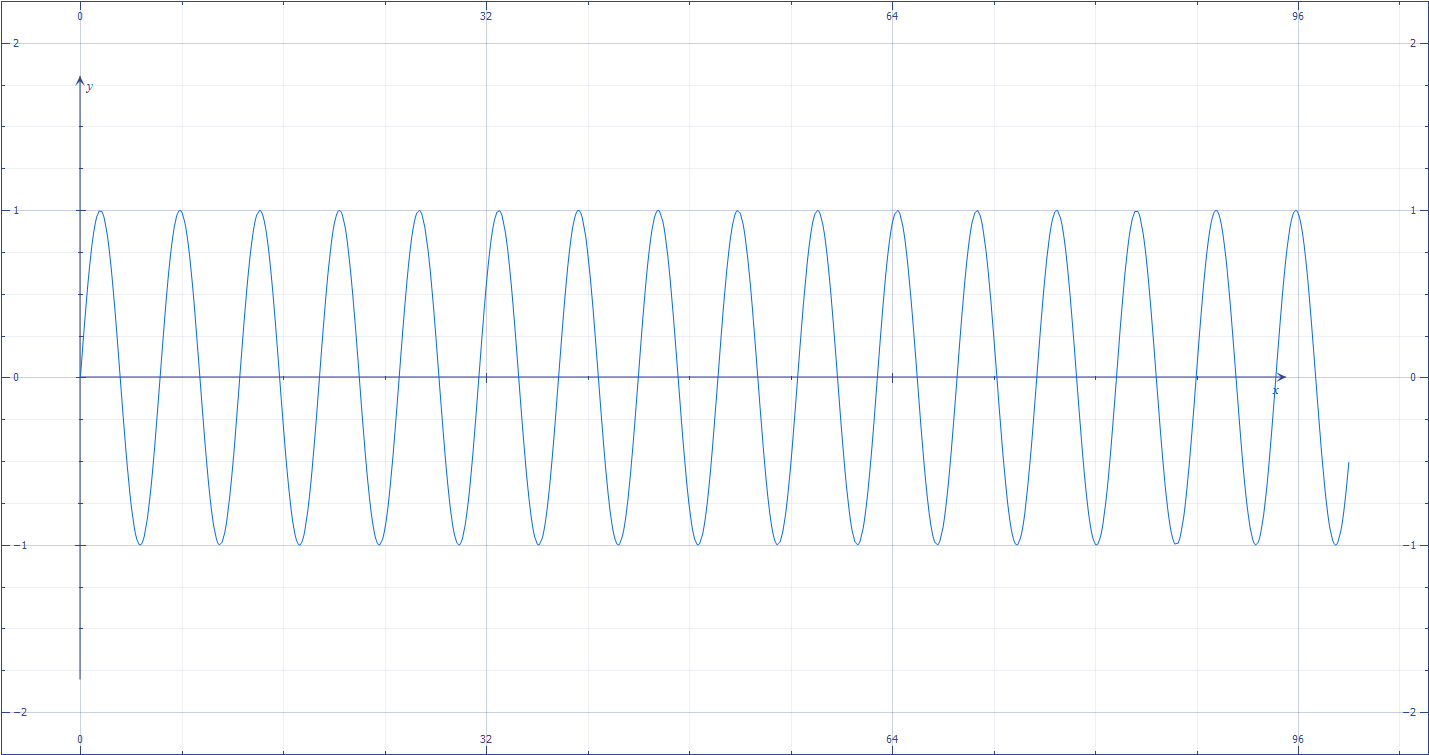
Figure 1.1.5a
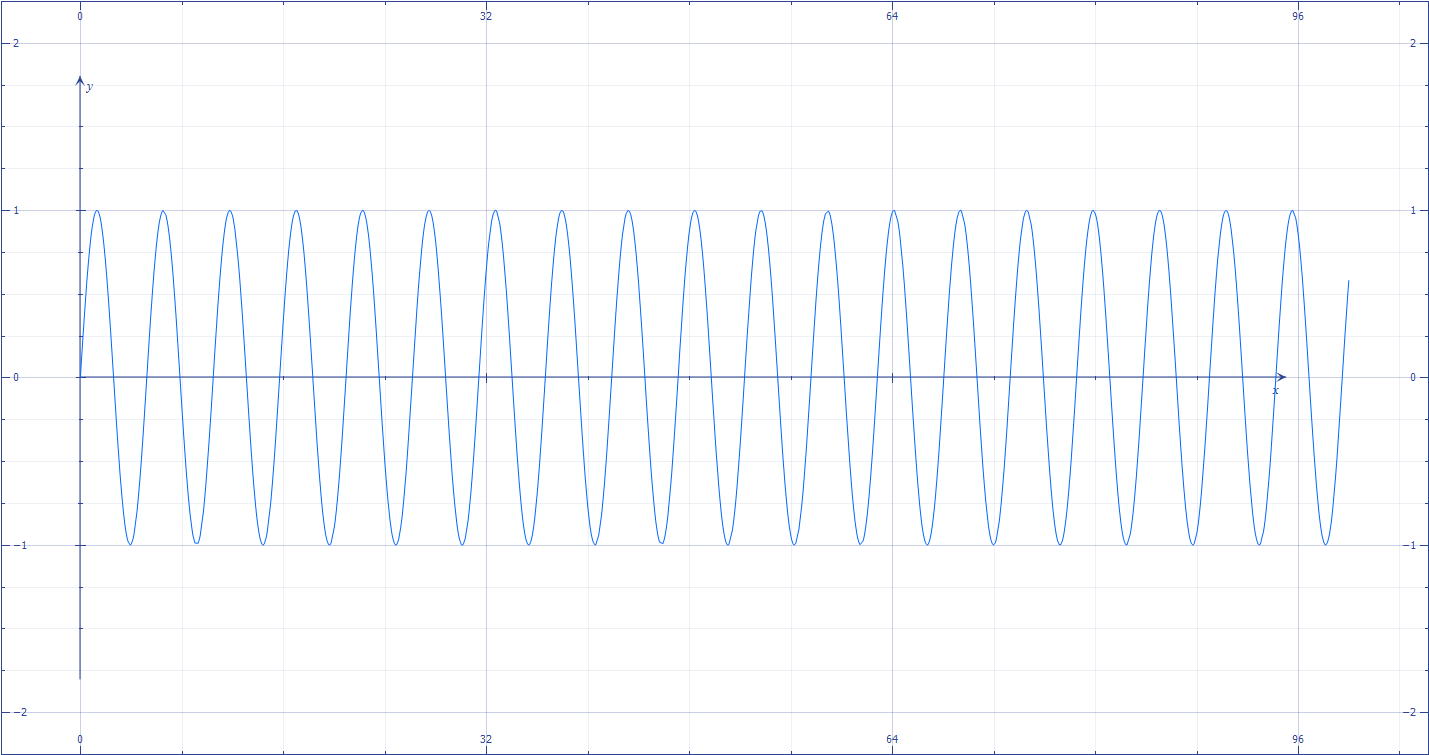
Figure 1.1.5b
If it is helpful to imagine these waves at 100 and 120 Hz respectively, feel free to do so. Now suppose that these waves interfere in the air. They will add together into what might be a surprising new waveform, shown in Figure 1.1.5c:
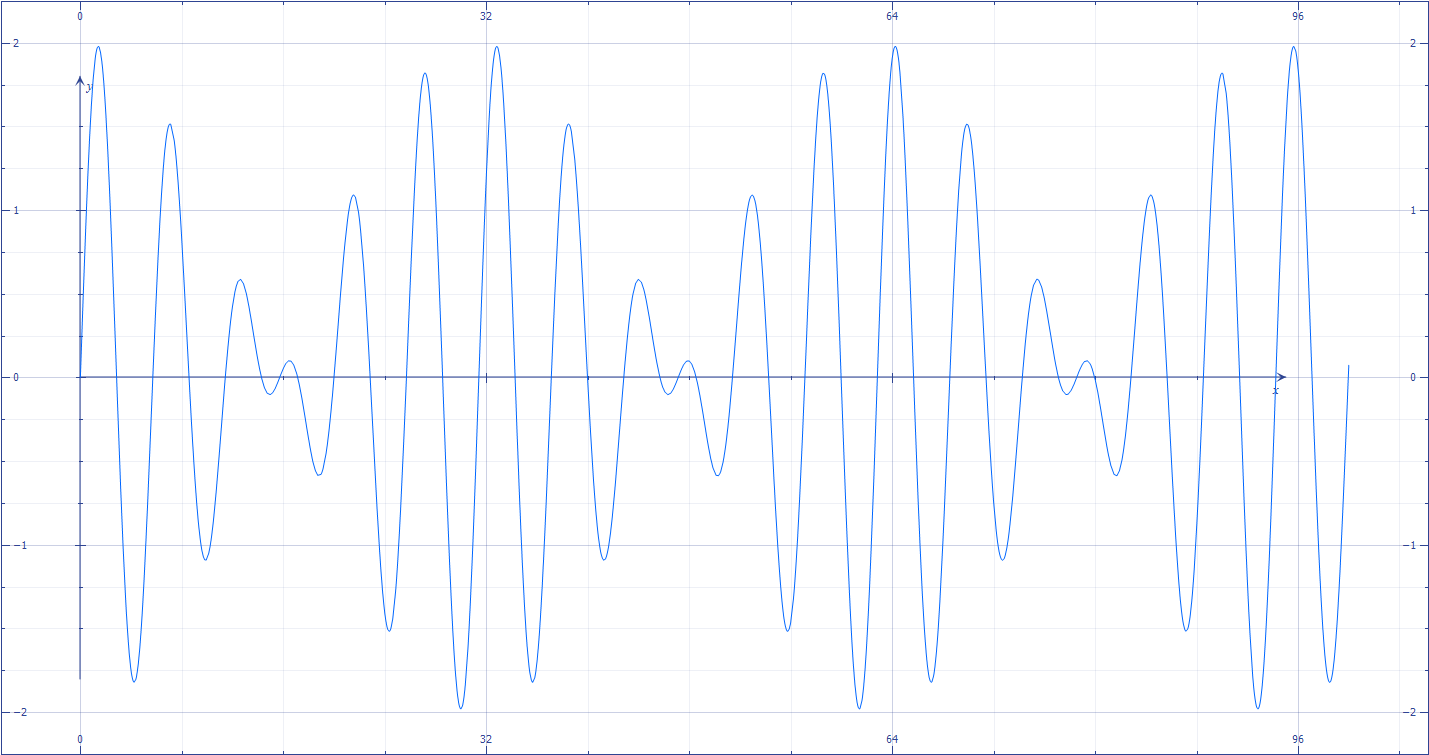
Figure 1.1.5c
Notice the repeated shifts in amplitude - some points on the waveform are nearly silent, while others have an amplitude twice as great as that of the original two waves. We hear this composite waveform as "beating," rather than a harmony. In fact, any time two pitches are separated by less than 25 Hz or so in frequency, we tend to hear them as beats rather than two separate notes. This is why composers don't use smaller intervals (like major thirds) in low bass harmonies - lower intervals are separated by fewer Hz than higher intervals, a fact we will dive into next section.
If we imagine that the waves in 1.1.5a and 1.1.5b are at 100 and 120 Hz respectively, then the beat pattern will repeat every 0.05 seconds, or 20 times per second. This is not a pleasant thing to hear.
Now suppose your left ear could only hear the 100 Hz signal, and your right ear could only hear the 120 Hz signal (something more advanced Audacity users can do in stereo with headphones on), beats would still be heard. This is more amazing than one might initially think, because the waves never physically interfere in the air. Because our ears combine sounds together in the brain, we artificially recreate the beats when we perceive the sound! This phenomenon is called binaural beats, and it serves as a reminder for just how incredible our brains are.
Of course, like all physics, it isn't this simple. In more complex waveforms, beats can be heard even if the pitches we perceive agree, because the overtones might be in a dissonant position that produces beats. This won't make sense for another couple of sections, but keep it in mind. Tuning is not a simple task.